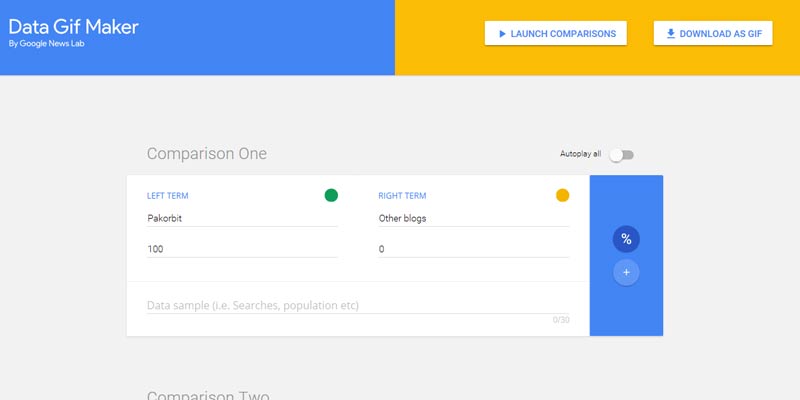
Google has launched a new animation tool which allows you to turn boring number charts into more entertaining GIF illustrations.

By using this new Data Gif Maker, users can set their desired parameters and transform data in the form of visuals. These animations can be used for a variety of sophisticated storytelling approaches among data journalists.
This tool is usually used to represent competing search interest, but it can show whatever you want it to, including polling numbers, sales figures, movie ratings, etc.
How to use Data GIF Maker:
The process is pretty straight forward and can be used with ease
- Enter two data points
- Add names for data points
- Select colors
- Chose explanatory text
- Hit “Launch Comparisons” and “Download as Gif”

You can follow this link to start creating animated illustrations for your boring data.


